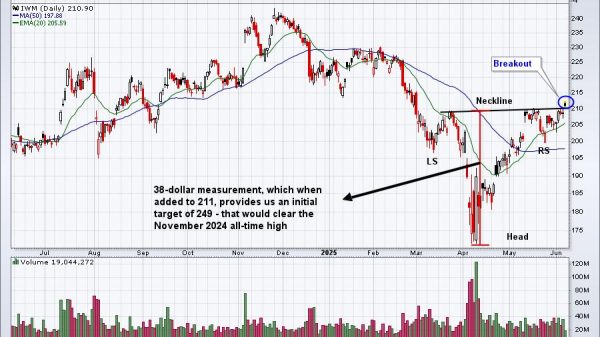
 Bullish signal alert! Over 50% of S&P 500 stocks are now above their 200-day moving average.
In this video, Dave explains this key market breadth indicator and what it means for stock market trends. He shows how moving average breadth has reached a bullish milestone, what this means based on historical signals over the past 15 years, and how it compares to the Zweig Breadth Thrust. He also introduces the stoplight market phase technique—a simple but effective method using StockCharts tools to assess market conditions in real time.
This video originally premiered on May 13, 2025. Watch on StockCharts’ dedicated David Keller page!
Previously recorded videos from Dave are available at this link.


