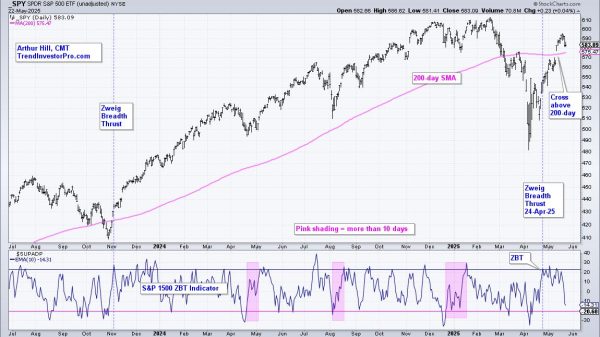
 Join Dave as he shares how he uses the power of Fibonacci retracements to anticipate potential turning points. He takes viewers through the process of determining what price levels to use to set up a Fibonacci framework, and, from there, explains what Fibonacci retracements are telling him about the charts of NCLH, RTX, and the S&P 500
This video originally premiered on June 24, 2025. Watch on StockCharts’ dedicated David Keller page!
Previously recorded videos from Dave are available at this link.


